
Overview
The Influencer tab is one of the three primary sections of an Influencer Report. It provides a comprehensive view of an influencer's performance by combining audience growth, engagement metrics, content analysis, and profile information into a single report.
Rather than relying on the native analytics available on individual social platforms, the Influencer tab standardizes key metrics so you can more easily evaluate and compare influencer performance across channels.
Performance Metrics
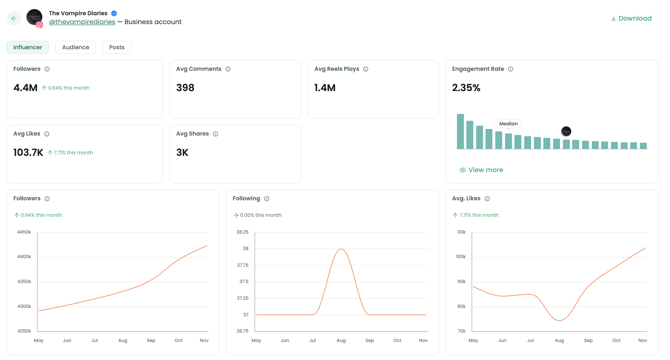
The top section of the report provides a snapshot of the influencer's current performance.
Followers
Displays the influencer's current follower count along with the change compared to the previous month.
This metric helps you quickly understand whether the influencer's audience is growing, remaining stable, or declining.
Average Comments
Shows the average number of comments received across the influencer's 30 most recent posts.
Comments provide insight into how actively an audience engages with the influencer's content.
Average Reels Plays
Displays the average number of Reel plays across the influencer's 30 most recent posts.
This metric helps evaluate overall content reach and video performance.
Average Likes
Shows the average number of likes received across the influencer's 30 most recent posts.
Likes provide a quick indication of audience engagement and content popularity.
Average Shares
Displays the average number of shares across the influencer's 30 most recent posts.
High share counts often indicate that content resonates strongly with an audience and is being distributed beyond the influencer's immediate followers.
Engagement Rate
The Engagement Rate measures audience engagement relative to the influencer's audience size.
It is calculated as:
Average Likes ÷ Total Followers
This metric allows you to compare influencers of different audience sizes more effectively.
Audience Growth & Engagement Trends
Below the performance summary, three charts illustrate how the influencer's performance has changed over time.
These visualizations track:
- Follower growth
- Following growth
- Average likes across the last 30 posts
Each chart compares the current reporting period with the previous month, making it easier to identify upward or downward performance trends.
Engagement Distribution
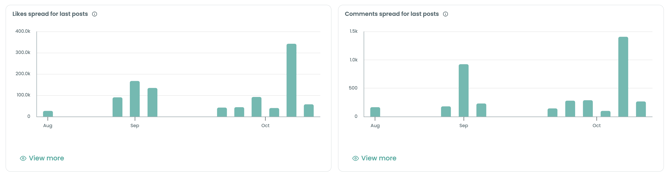
The Engagement Spread for Last Posts section breaks engagement into two separate visualizations:
- Likes Spread
- Comments Spread
Why Are Likes and Comments Displayed Separately?
Likes typically occur in much higher volumes than comments.
Displaying both metrics on the same graph can make comment activity difficult to interpret because of the difference in scale.
By separating these visualizations, the report allows you to:
- Compare likes and comments independently.
- Better understand engagement patterns.
- Capture clearer screenshots for presentations and reports.
- Interpret performance without relying on hover tooltips.
Content Insights
The lower section of the Influencer tab analyzes the influencer's content to identify recurring topics, themes, and audience signals.
Relevant Tags
Displays a keyword cloud highlighting the topics most frequently associated with the influencer's recent content.
These keywords help summarize the influencer's primary areas of focus.
Lookalike Influencers
Identifies influencers who create content on similar topics.
This insight can be useful for:
- Competitive analysis
- Influencer discovery
- Campaign planning
- Partnership opportunities
Popular Hashtags
Shows the hashtags most frequently used across the influencer's 30 most recent posts.
These hashtags help identify recurring campaigns, topics, and content themes.
Popular Mentions
Displays the accounts most frequently mentioned throughout the influencer's recent content.
This insight can help identify recurring collaborations, partnerships, brands, and creator relationships.
Influencer Interests
Identifies the influencer's primary interests by analyzing:
- Captions
- Hashtags
- Mentions
- Location tags
These insights provide a broader understanding of the subjects the influencer regularly discusses.
Brand Affinity
Highlights the brands most closely associated with the influencer's content.
Brand affinities are determined by analyzing:
- Captions
- Hashtags
- Mentions
- Location tags
This section can help identify existing partnerships and potential collaboration opportunities.
Contact Information
Displays publicly available contact details and links to the influencer's connected social media profiles.
This information can help streamline outreach and influencer management activities.