
Overview
Follow this guide to learn how to interpret the Online Habits tab in an Audiense Insights report. The Online Habits tab provides insights into how your audience behaves across digital channels by analyzing device usage, social media relevance, publishing behavior, engagement patterns, and periods of activity.
These insights help you understand not only where your audience spends time online, but also how they interact with content and when they are most active. When compared against your selected baseline, these behaviors can help inform content strategies, publishing schedules, and channel selection.
Understanding the Online Habits Tab
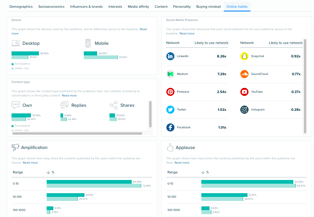
The Online Habits tab summarizes several behavioral metrics that describe how your audience interacts with social platforms and digital content.
The tab includes insights for:
- Device usage
- Social Media Relevance
- Content type
- Amplification
- Applause
- Active days
- Active hours
Together, these metrics provide a more complete picture of your audience's online behavior and help identify opportunities to optimize marketing, content distribution, and engagement strategies.
Device Usage
The Device chart compares your audience's preferred device types against the selected baseline. The visualization shows whether audience members are more likely to use mobile devices or desktop devices when engaging on X. Audiense determines device usage by analyzing the applications and clients users employ to publish content on X and classifying those clients by device type.
Examples of mobile clients include:
- Twitter for Android
- Twitter for iPhone (iOS)
- Twitter for iPad
Examples of desktop clients include:
- Twitter for Mac
- Hootsuite Desktop Application
By comparing this distribution against the baseline, you can better understand whether your audience is more mobile-first or desktop-oriented than a typical audience.
Social Media Relevance
The Social Media Relevance chart compares the relative importance of different social platforms for your audience against the selected baseline. Rather than measuring platform usage directly, this visualization estimates how relevant each social network is for your audience based on publicly available engagement signals across X.
Supported networks include:
- Discord
- Medium
- Sina Weibo
- Snapchat
- SoundCloud
- Spotify
- TikTok
- Telegram
- Twitch
- X (Twitter)
- YouTube
Interpreting the Results
It is important to understand that this graph compares your audience against the selected baseline.
For example:
✔ Correct interpretation
Snapchat is twice as relevant for this audience compared to the selected baseline.
✘ Incorrect interpretation
There are twice as many Snapchat users in this audience.
Similarly, the chart should not be interpreted as a comparison between individual social networks. For example, it does not indicate that Facebook is used more than X or that one platform has more users than another. Instead, it highlights which platforms are comparatively more relevant to your audience.
How Social Media Relevance Is Calculated
Audiense uses machine learning models to estimate social media relevance based on publicly available engagement signals.
These signals may include:
- Posts
- Likes
- Follows
- Clicks
- Profile information
- Public demographic information
- Additional behavioral indicators
Because these insights are inferred, they represent estimated audience behaviors rather than direct measurements of platform usage.
Content Type
The Content Type visualization shows the types of content your audience most frequently publishes.
This includes:
- Original content
- Replies and conversations
- Shared or third-party content
Understanding how your audience communicates can help guide your own content strategy by identifying whether they tend to create original discussions, participate in conversations, or primarily amplify existing content.
Amplification
The Amplification metric measures how frequently content published by members of your audience is shared by others. Higher amplification indicates that audience members regularly create content that is redistributed across their networks. This metric can help identify communities that generate highly shareable content.
Applause
The Applause metric measures how frequently content published by audience members receives likes or other positive engagement. Unlike Amplification, which focuses on shares, Applause reflects how well audience-generated content resonates with others through positive reactions. Reviewing both metrics together provides a broader understanding of overall engagement.
Active Days
The Active Days visualization identifies the days of the week when your audience is most active across social platforms. These insights can help determine optimal publishing schedules or identify when audience engagement is likely to be highest.
Active Hours
The Active Hours visualization highlights the times of day when your audience is most active online. Understanding these activity patterns can help optimize publishing schedules, campaign timing, and community engagement efforts. When combined with the Active Days visualization, this information provides a clearer picture of when your audience is most likely to interact with content.